
Shopify subscription analytics: what to measure, and how to calculate it

A Shopify store running subscriptions relies on six numbers — billable active subscribers, monthly recurring revenue normalised across cadences, voluntary churn, involuntary churn, cohort retention, and lifetime value calculated on gross profit — and none of them is a figure Shopify hands you finished. Each is a calculation layered on data Shopify does expose, and each has a specific way of going wrong.
The drift usually starts somewhere very ordinary. Shopify’s free Subscriptions app has a performance section reporting subscriptions revenue, active subscriptions, new subscriptions and canceled subscriptions for a chosen timeframe. Its definition of active subscriptions is “the number of active subscription contracts within the timeframe selected,” and Shopify notes that this figure “includes paused contracts and skipped orders.” That is a reasonable definition of an active relationship. It is not a count of who will be billed next month — and if it becomes the denominator of your churn rate and the multiplier in your revenue forecast, both inherit the gap.
This is a guide to the six metrics themselves: what each one answers, how to derive it from what Shopify stores, and the trap that makes it misleading.
Quick answer: the six metrics, and what each is for
| Metric | The question it answers | Built from | The trap |
|---|---|---|---|
| Billable active subscribers | How many people will be charged next cycle? | Subscription contracts with status ACTIVE | Paused contracts counted as active; contracts counted as customers |
| MRR | How big is the recurring base, in one comparable number? | Contract billing policies × charge amounts | Treating every cadence as monthly — “every 4 weeks” is not a month |
| Voluntary churn | Are people choosing to leave? | Contracts ending with status CANCELLED | Mixed in with billing failures; end-of-period denominator |
| Involuntary churn | Are we losing people to broken cards? | Contracts ending with status FAILED | Counted as product churn, so the wrong fix gets funded |
| Cohort retention | When do we lose people? | Signup month × months still active | Blended churn hides the timing entirely |
| LTV (gross profit) | What can we afford to pay for a subscriber? | AOV × margin × expected lifetime | Building it on revenue instead of margin |
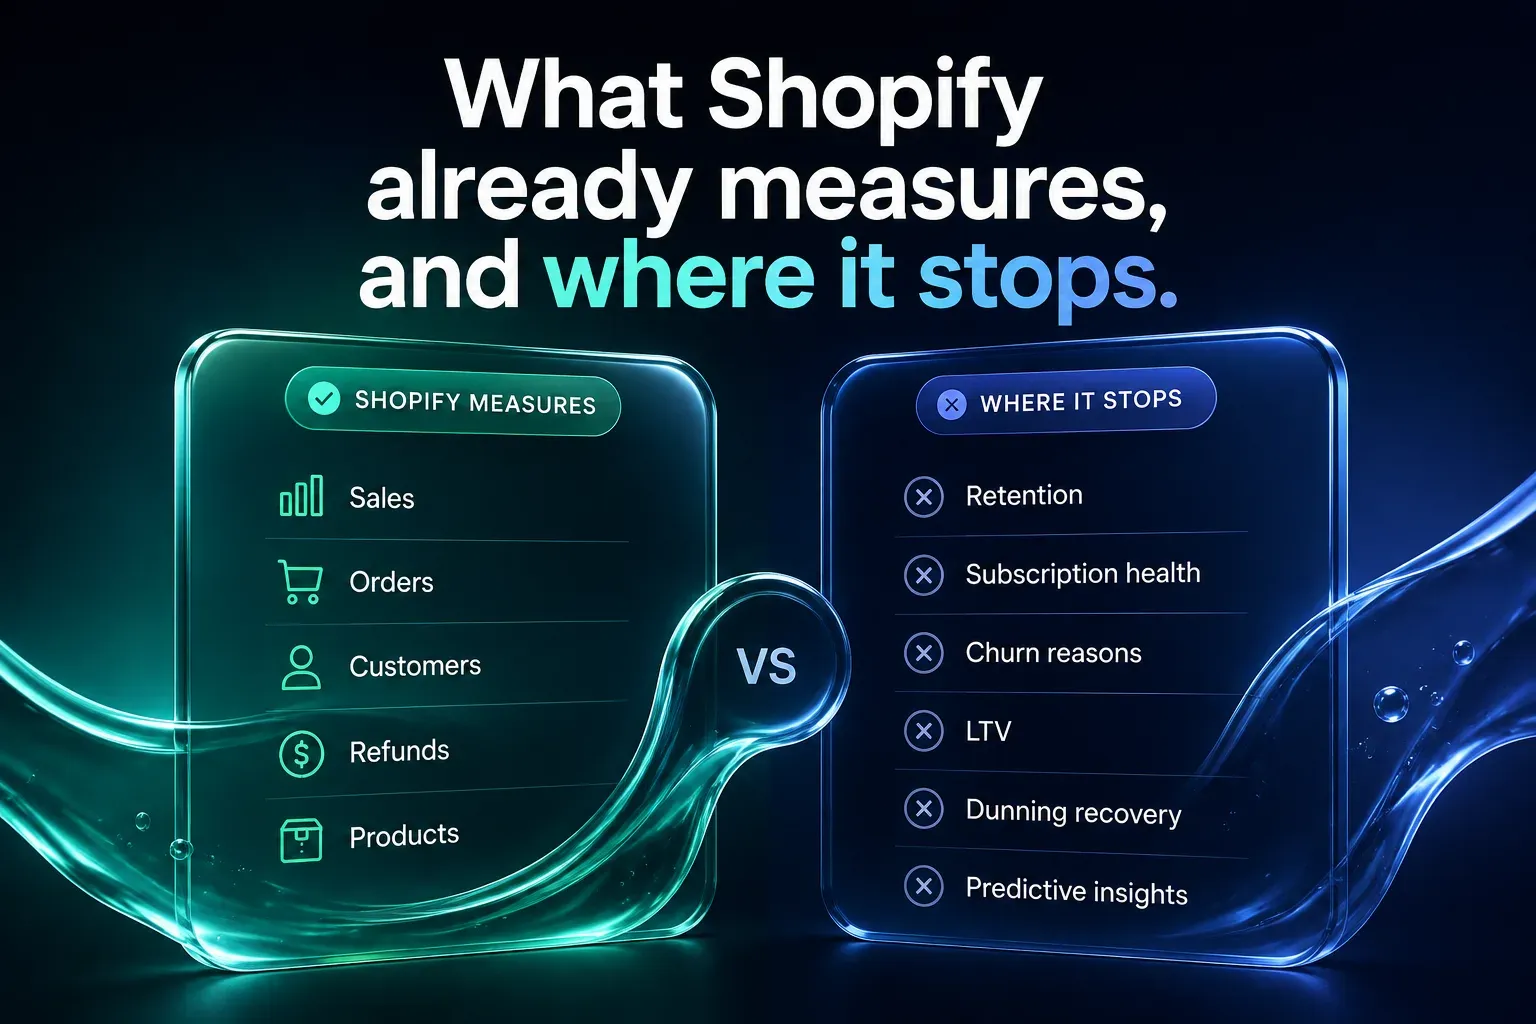
What Shopify already measures, and where it stops
Two pieces of Shopify’s own machinery matter before you build anything.
The native dashboard gives four figures, not four rates. The Shopify Subscriptions app’s performance section reports subscriptions revenue (“recurring subscriptions revenue generated within the timeframe selected”), active subscriptions, new subscriptions and canceled subscriptions, with comparison against the previous 7, 30 or 90 days, and each metric opens into a report over time. That is a genuinely useful pulse check. What it is not is a rate: a churn rate needs a denominator, an MRR figure needs a cadence convention, and both of those are editorial decisions Shopify leaves to you.
Shopify’s data model already separates the two kinds of churn. A subscription contract carries a status, and the documented values are precise about why a contract ended:
ACTIVE— “the contract is active and continuing per its policies”PAUSED— “the contract is temporarily paused and is expected to resume in the future”CANCELLED— “the contract was ended by an unplanned customer action”EXPIRED— “the contract has ended per the expected circumstances. All billing and delivery cycles of the subscriptions were executed”FAILED— “the contract ended because billing failed and no further billing attempts are expected”
Read those definitions closely and the reporting job gets easier. CANCELLED is voluntary churn. FAILED is involuntary churn. EXPIRED is neither — a prepaid six-month plan reaching its end is a renewal opportunity, not a loss, and counting it as churn makes prepaid look like a retention problem when it is a lifecycle event. The distinction most stores never make is already recorded against every contract they own.
1. Billable active subscribers: contracts are not customers
Billable active subscribers is the count of subscription contracts with status ACTIVE, excluding paused ones — the people a renewal will actually charge. It is the base for MRR, for churn, and for any stock forecast.
Two adjustments separate it from the headline figure:
Subtract paused contracts. Shopify’s dashboard metric includes them by design. A paused subscriber is worth keeping and worth reporting, but they are not billable this cycle. Keep both numbers and label which one you are quoting — a store with 1,000 active contracts and 120 paused has an 880-subscriber billing base.
Decide whether you are counting contracts or people. One customer can hold two contracts — a monthly bag of coffee for home and a second for the office. Counted as contracts they are two subscribers; counted as customers, one. Neither is wrong, but mixing them across metrics is: subscriber churn computed on contracts and LTV computed on customers will not reconcile, and the discrepancy is invisible until someone tries to.
2. MRR: why “every 4 weeks” is not a month
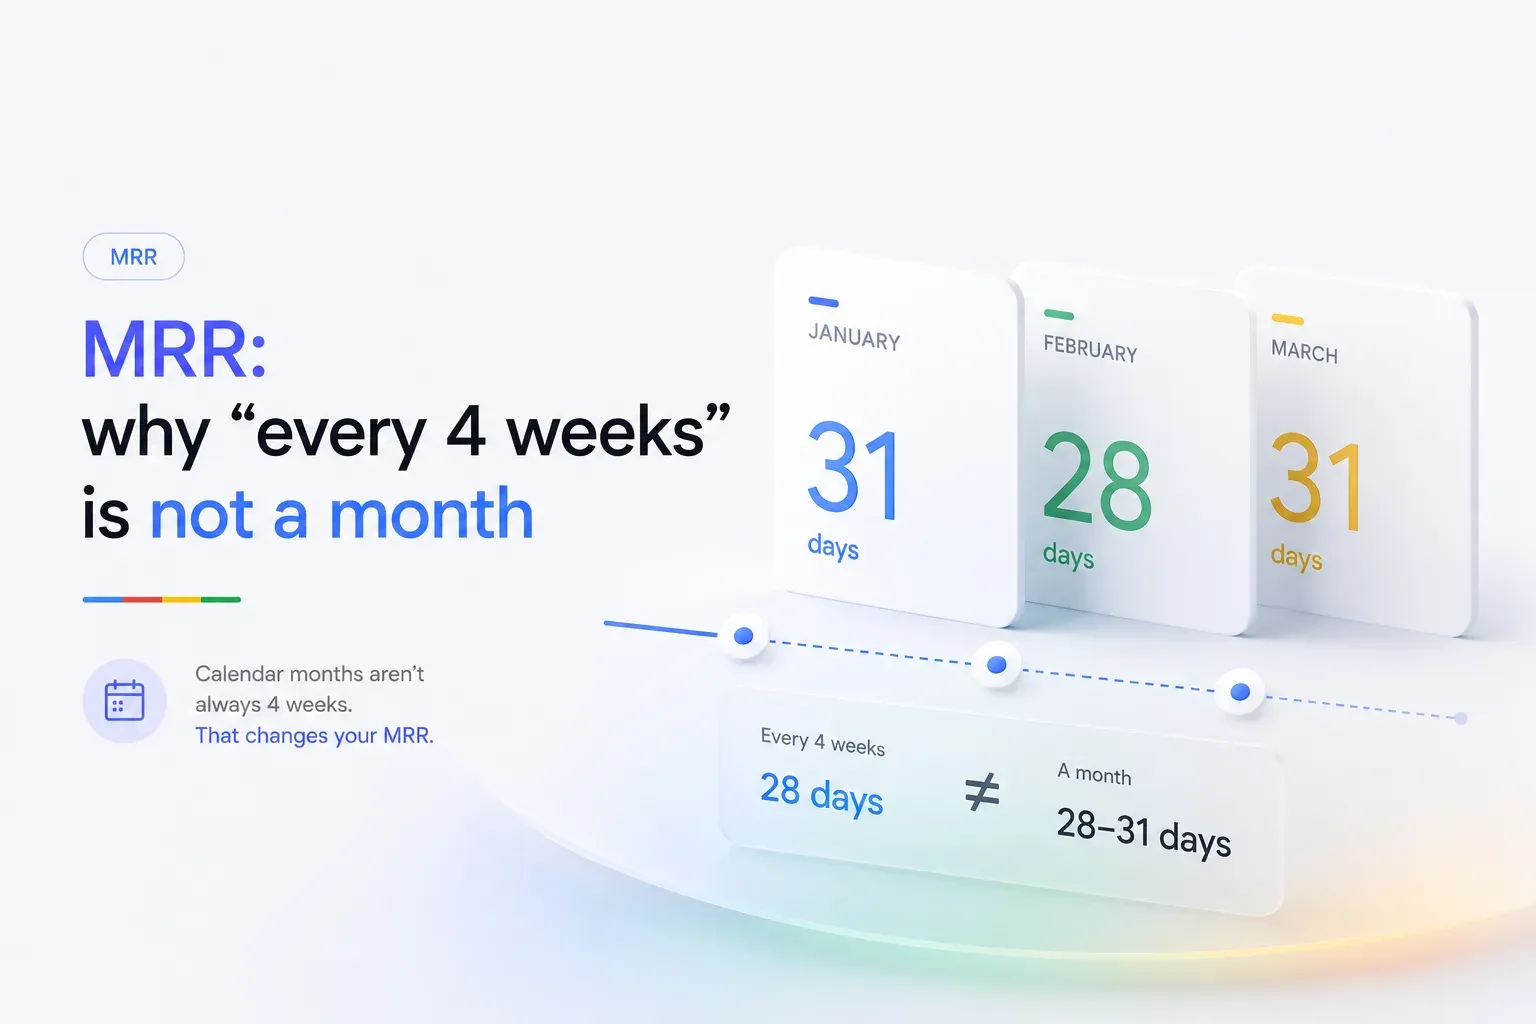
Monthly recurring revenue is the value of your active contracts expressed as one comparable monthly figure, which means converting every cadence to a monthly equivalent before adding anything up. This is where physical-product subscriptions quietly overstate or understate themselves, because their cadences are rarely monthly.
Shopify stores a billing cadence as an interval plus an interval count, where the interval is one of DAY, WEEK, MONTH or YEAR. So “every 4 weeks” is stored as WEEK × 4 — a genuinely different thing from MONTH × 1. Four weeks is 28 days; an average month is about 30.4. A four-weekly plan bills roughly 13 times a year, not 12.
The arithmetic follows directly:
| Cadence | Charges per month | $40 charge becomes |
|---|---|---|
Weekly (WEEK × 1) | 4.35 | $173.91 |
Every 2 weeks (WEEK × 2) | 2.17 | $86.96 |
Every 4 weeks (WEEK × 4) | 1.09 | $43.48 |
Monthly (MONTH × 1) | 1.00 | $40.00 |
Quarterly (MONTH × 3) | 0.33 | $13.33 |
Annual (YEAR × 1) | 0.083 | $3.33 |
Charges per month are 365.25 ÷ interval length ÷ 12, rounded.
Treating a four-weekly plan as monthly understates its recurring revenue by about 8.7% — and, more practically for a roastery, understates the number of times you will need to roast, pack and ship for that subscriber over a year by one whole cycle. On a base of 500 four-weekly subscribers that is 500 extra fulfilments a year that the “monthly” mental model never planned for.
Prepaid plans need the same treatment in the other direction. A six-month prepaid term charged once at $210 is $35 of MRR for six months, not $210 in one month and nothing after. Booking the cash where it landed makes one month look extraordinary and the next five look like collapse.
The full definition of the metric is in the MRR glossary entry; the point here is that the normalisation step, not the addition, is where the number is won or lost.
3. Churn, split at the source
Churn rate is the number of subscribers lost in a period divided by the number of subscribers at the start of that period, times 100 — the formula Recurly states in its published benchmarks, and the one to use unless you have a reason not to.
Two decisions determine whether the result is honest.
Use the start-of-period base. Dividing by the end-of-period count flatters any growing store, because new subscribers who were never at risk pad the denominator. The faster you grow, the better your churn looks, which is precisely backwards.
Split it by contract status. Losses that arrive as CANCELLED are decisions; losses that arrive as FAILED are plumbing. Across the Recurly network in July 2026, average monthly churn ran at 3.60% overall — 2.34% voluntary and 1.25% involuntary. A store reporting one blended number cannot tell which of its two very different problems it has, and the remedies do not transfer: no amount of product work fixes an expired card, and no retry schedule fixes a box that arrives faster than the customer drinks it.
One measurement rule matters enough to repeat from the failed-payment recovery playbook: count failures per contract, not per billing attempt. A contract that fails, retries three times and recovers is one save, not three failures — measured per attempt, better dunning makes your failure rate look worse.
It is also worth internalising how churn compounds, because monthly rates read as small. At 5% monthly churn, 0.95¹² of a cohort survives a year — about 54%, meaning you replace nearly half the base annually just to stand still. At 8%, a year leaves 37%. That is arithmetic, not a benchmark, and it is the clearest argument for why a percentage point of churn is worth more attention than a percentage point of conversion rate.
4. Cohort retention: the only view that shows when you lose people
Cohort retention groups subscribers by the month they joined and tracks what share of each group is still active one, two, three and six months later. Blended churn cannot do this. A store losing 6% a month and a store losing 20% in month three and almost nothing afterwards can report the same average while having completely different businesses.
Building it needs less than people expect: the contract’s creation date, its current status, and the date it ended. Group by creation month, then for each subsequent month count how many of that cohort are still ACTIVE or PAUSED. A monthly export is enough; this is a quarterly exercise, not a live dashboard.
What you are looking for is the shape of the curve, not its level. A steep early drop that then flattens says the problem is onboarding and the first few boxes — which for coffee tends to cluster around the third delivery, where novelty has worn off and the subscription has to justify itself. A curve that declines steadily forever says the problem is the ongoing proposition: cadence, variety, or price. The two call for entirely different work, and blended churn tells you nothing about which one you have.
5. Lifetime value, on gross profit rather than revenue
Customer lifetime value is the gross profit a subscriber generates across their whole relationship, which for a subscription is average order value × gross margin × the number of orders they place before leaving. A rough steady-state estimate is monthly gross profit per subscriber ÷ monthly churn rate: at $12 of gross profit per box and 6% monthly churn, roughly $200.
Building LTV on revenue rather than margin is the common error and it flatters exactly the businesses that can least afford it. Coffee is one: green cost, roast loss, packaging and a shipping band consume most of a bag’s price before anything reaches the bottom line, so a revenue-based LTV can be three or four times the number you can actually spend to acquire someone.
Two costs belong inside the calculation and are often left out. Shipping, because in a subscription it recurs with every order rather than being a one-off. And your subscription app, if it charges a percentage of subscription revenue — that fee scales with the same number LTV is built from, which is the specific reason flat-fee and percentage pricing diverge as you grow.
6. Recovery rate: whether dunning is actually working
Recovery rate is the share of contracts that entered a failed-payment sequence and came back to ACTIVE. It is the one metric here that reports on a system rather than on customers, and it is the fastest to move, because the subscribers involved have not decided anything — they still want the product.
Measure it per contract, over a fixed window from the first failure (ten to fourteen days is a sensible frame, since recovery decays quickly), and track the reason mix alongside it. If most of your failures are expired cards, retries will not help and the number to improve is how quickly customers get a working update link. The mechanics of that are in the failed-payment recovery playbook; this section is only about the number that tells you whether the playbook is working.
How often to look at each one
Not every metric deserves a dashboard. A workable rhythm:
- Weekly: billable active subscribers, failed payments and recovery. These are operational — you can act on them the same week.
- Monthly: MRR, voluntary churn, involuntary churn, average order value. Long enough to be signal rather than noise.
- Quarterly: cohort retention and LTV. These need several months of data before they say anything, and watching them weekly invites reading noise as a trend.
If you sell coffee, add one more to the weekly list: upcoming charges by cadence, which is what turns a subscriber count into a roast plan. The operator guide to running a coffee subscription on Shopify covers how that forecast is built.
Why subscription benchmarks don’t compare until your definitions match
Two stores can both report “6% monthly churn” and mean entirely different things — one counting paused contracts in the base and one not, one counting contracts and one counting customers, one including billing failures and one excluding them, one dividing by the start of the month and one by the end. Every one of those choices moves the number by more than the difference most benchmark articles are asking you to care about.
This is why the Recurly figures above are quoted with their method attached and why they are network-wide rather than category-specific: one system computed them one way across many merchants, which is what makes them comparable to each other. It is also why the coffee-specific churn ranges that circulate — roughly 5–10% a month for replenishment, 10–15% for curated and discovery boxes — are best read as orders of magnitude. They appear in vendor and agency write-ups without a disclosed dataset behind them, and none of them tell you which denominator was used.
The benchmark worth having is your own: one definition, written down, measured the same way every month, with the voluntary and involuntary halves reported separately. A trend line you trust beats an industry average you cannot audit.
How Curobi reports these
Curobi’s subscription analytics surface the operational half of this list directly: active subscribers, recurring revenue, upcoming and processed charges, failed-payment recovery and cancellations. The subscriptions dashboard and CSV export ship on every plan; the fuller revenue, churn and renewal analytics, along with the failed-payment recovery view, are part of Pro.
The honest limit is worth stating, because it applies to every subscription app and not only this one: cohort retention curves and a gross-profit LTV are not things a subscription app computes for you, because it does not know your green-coffee cost, your packaging cost or your shipping bands. What an app can do is give you exports clean enough to build them in a spreadsheet or a reporting tool — which is the practical reason to care that your subscription data is not locked inside a proprietary billing layer. Because Curobi settles every charge through Shopify’s native checkout, subscription orders also appear in Shopify’s own analytics and in whatever reporting app you already run.
Frequently asked questions
Does Shopify report MRR and churn for subscriptions?
Not directly. The Shopify Subscriptions app reports four metrics — subscriptions revenue, active subscriptions, new subscriptions and canceled subscriptions — for a selected timeframe, and lets you open each one as a report over time. Those are counts and totals, not rates: monthly recurring revenue and a churn rate are both calculations you make on top of them, and both require choices Shopify does not make for you. Shopify’s own definition of active subscriptions includes paused contracts and skipped orders, so if you use that figure as your subscriber base without adjusting it, both your MRR and your churn rate will be wrong in the same direction.
How do I calculate subscription churn rate on Shopify?
Divide the number of subscribers lost during a period by the number of subscribers at the start of that period, then multiply by 100 — that is the standard subscription definition, and Recurly states it the same way in its churn benchmarks. Two details decide whether the number means anything. Use the base at the start of the period, not the end, because an end-of-period base flatters any store that is growing. And split the losses by the reason the contract ended: on Shopify a contract that ends by customer action carries the status CANCELLED, while one that ends because billing failed carries FAILED, so voluntary and involuntary churn can be separated at source rather than estimated.
Why is my active subscriber count higher than the number of charges I process?
Because paused subscribers are still counted as active. Shopify’s Subscriptions analytics defines active subscriptions as the number of active subscription contracts in the timeframe and states that it includes paused contracts and skipped orders. A paused contract is a real subscriber worth keeping, but it will not be billed this cycle, so a store with 1,000 active contracts and 120 paused ones has 880 billable subscribers. Track both figures and label them: active contracts for the size of the relationship base, billable subscribers for revenue and forecasting.
What is a good churn rate for a coffee subscription?
There is no auditable published benchmark for coffee subscriptions specifically, and the figures that circulate — roughly 5 to 10 percent a month for replenishment programs and 10 to 15 percent for curated or discovery boxes — come from vendor and agency write-ups rather than a disclosed dataset, so they are worth treating as rough orders of magnitude rather than targets. The one network-wide figure that is published with a method attached is Recurly’s, which put average monthly churn at 3.60% across all industries in July 2026, split 2.34% voluntary and 1.25% involuntary. The more useful comparison is against yourself: the same definition, measured the same way, month over month.
Should I measure subscription churn by subscriber or by revenue?
Measure both, because they answer different questions. Subscriber churn tells you how well the product and the experience are holding people, and it is the number to use when judging retention work. Revenue churn tells you what the losses are worth, and it can move in the opposite direction — losing ten subscribers on a small monthly bag while keeping ten on a large prepaid plan is a modest revenue month and a poor retention month. If you only have the budget to build one, build subscriber churn first and split it into voluntary and involuntary, because that split is what tells you whether the fix is a product decision or a billing decision.
The takeaway
Subscription reporting goes wrong at the definitions, not at the arithmetic. Shopify gives you contract-level data that already distinguishes a cancellation from a billing failure from a completed prepaid term, and a dashboard whose headline “active” figure deliberately includes people who will not be charged. Reconcile those two things once — decide what counts as a billable subscriber, normalise every cadence to a month, split churn by the status that ended the contract — and the rest of subscription analytics becomes ordinary work.
Everything after that is a question of what you do with the numbers. Cohort curves tell you when to intervene, the voluntary/involuntary split tells you what kind of intervention to build, and a gross-profit LTV tells you what any of it is worth paying for. None of the six metrics requires software you do not already have. They require agreeing what they mean, and then not quietly changing it.
Sources: Shopify Help Center: Shopify Subscriptions analytics overview, Shopify SubscriptionContractSubscriptionStatus reference, Shopify SellingPlanInterval reference, Shopify SubscriptionBillingPolicy reference, and Recurly churn rate benchmarks (July 2026 data). All retrieved 19 August 2026.
Related reading: how to reduce subscription churn for what to do once the split is visible, how to recover failed subscription payments on Shopify for the involuntary half, and the month-3 churn cliff for the pattern cohort curves usually reveal first.