
Subscription commerce statistics (2027): sourced and dated

Subscription commerce has no trustworthy single market size, but it does have solid narrower numbers. In 2026, 3.2% of the online retailers in Digital Commerce 360’s North American Top 1000 sold by subscription in some form. On Shopify, StoreLeads counted 192,442 subscription-app installs across 3,245,947 live stores on 6 November 2026, so at most about 5.9% of stores have one. In a January 2026 survey, 4% of US respondents paid for a physical-goods subscription box. And about a quarter to a third of subscription churn comes from failed payments, not from people choosing to leave, on Recurly’s July 2026 data and on Stripe data analysed by Churnkey. Published estimates of the “subscription e-commerce market” for 2026 run from $22.51 billion to $3.09 trillion, because each research firm counts different things.
This page lists subscription commerce statistics (physical-goods subscriptions sold online, subscription boxes and subscribe-and-save) grouped by the question they answer. Each entry has a one-sentence statement you can quote, a link to the original source, the date it was published or measured, and what it actually measures. Where a widely repeated number traces to nothing, it is in the section on stats we left out. The title says 2027 because this is the list to use going into 2027; every figure keeps its own date, and none of them is a 2027 measurement.
Last checked: 17 November 2026. Every source was opened between 13 and 17 November 2026. Curobi, which publishes this page, sells a Shopify subscription app; none of the figures is Curobi’s own data. Recharge, whose platform data appears in several entries, is a subscription app that competes with Curobi, and Recurly, Chargebee, Churnkey and Bango sell subscription billing, retention or bundling services. Their numbers are labelled as vendor data.
The most-used subscription statistics at a glance
| Question | Best available figure | Source and date | Type |
|---|---|---|---|
| How big is the market? | No agreed figure: 2026 estimates run from $22.51 billion to $3.09 trillion | Five research firms, pages dated May to November 2026 | Vendor estimates, no published method |
| How many large retailers sell subscriptions? | 3.2% of the North American Top 1000 | Digital Commerce 360, 14 May 2026 | Research firm dataset |
| How many Shopify stores have a subscription app? | At most about 5.9% (192,442 installs on 3,245,947 live stores) | StoreLeads, updated 6 November 2026 | Research firm dataset, one provider |
| How many people pay for a subscription box? | 4% of US respondents | Bango and 3Gem, fielded January 2026 | Vendor survey, 4,000 US and UK consumers |
| What share of churn is involuntary? | About a quarter to a third | Recurly, July 2026 data; Stripe data via Churnkey, 2024 data | Vendor platform data |
| How much of failed-payment churn can retries recover? | 51% with Stripe’s retries alone, in 5.5 days on average | Churnkey on Stripe data, published 14 November 2025 | Vendor platform data |
| When do subscribers cancel? | About 61% of voluntary cancellations happen at the first two renewals | Recharge, July 2026 | Vendor platform data |
| Can AI assistants sell a subscription? | Not in Google’s direct checkout: subscription-only products are excluded | Shopify Help Center, read 17 November 2026 | Primary: platform documentation |
How to read and cite these numbers
Each entry carries one of eight labels. Primary: government means a government statistic or an enforcement document. Primary: company filing or results means a regulatory filing or a company’s own published results. Primary: peer-reviewed means a journal article. Primary: platform documentation means Shopify’s own rules. Research firm dataset means a company that measures something it does not sell into, such as store counts or retailer rankings. Vendor platform data means a billing or subscription company reporting on its own customers: real data, but drawn from that company’s merchants and published without full methods. Vendor survey means a consumer or merchant survey run or commissioned by a company with something to sell, and vendor estimate, no published method means a market-research model whose method is not public.
To quote a figure, cite the original source linked beside it, with its date. The entries are numbered so this page can be updated without breaking references, and arithmetic we did ourselves is marked “our arithmetic”.

How big is the subscription commerce market?
Nobody can say with confidence. The table lists every 2026 estimate we could open. The two markets are different: “subscription e-commerce” is defined by each firm and usually includes digital services, while “subscription box” is narrower.
| # | Publisher | What it counts | 2025 | 2026 | Page date |
|---|---|---|---|---|---|
| 1 | Fortune Business Insights | Subscription e-commerce, including streaming (28.84% of 2026), digital and SaaS, memberships and media | $2,719.54bn | $3,088.71bn | 26 Oct 2026 |
| 2 | The Business Research Company | Subscription e-commerce; its segments list SaaS, video and music streaming, e-books and online courses | $536.72bn | $859.52bn | Sep 2026 |
| 3 | IMARC Group | Subscription e-commerce: service subscriptions, boxes and digital content, which the page says includes streaming and online courses | $393.0bn | $586.0bn | 10 Nov 2026 |
| 4 | Mordor Intelligence | “Goods and services sold through online subscription programs”, including access memberships and digital media | $180.48bn | $206.26bn | 11 Sep 2026 |
| 5 | Precedence Research | Subscription e-commerce, no definition given; its summary box labels the 2026 figure as 2025 | $20.58bn | $22.51bn | 29 May 2026 |
| 6 | The Business Research Company | Subscription boxes: “auto-ship and curated boxes” | $41.47bn | $49.7bn | 2026 |
| 7 | IMARC Group | Subscription boxes: “a package of niche retail products sent directly to a customer on a recurring basis” | $42.5bn | $47.9bn | 30 Oct 2026 |
| 8 | Fortune Business Insights | Subscription boxes | $18.95bn | $20.12bn | 26 Oct 2026 |
All eight are vendor estimates, no published method: each firm sells the full report and none sets out a method someone else could repeat.
Why the estimates disagree. The 137-fold gap between the highest and lowest 2026 subscription e-commerce figures (our arithmetic) is mostly about what each firm counts. The trillion-dollar figure includes video streaming. The Business Research Company and IMARC also count software, e-books or online courses, and The Business Research Company’s own figures imply 60.1% growth in one year, from $536.72 billion to $859.52 billion. For comparison, the US Census Bureau measured all US retail e-commerce growing 12.2% year on year in the second quarter of 2026 (entry 9). Even the box estimates differ by a factor of about 2.5. None of the eight isolates physical-goods subscriptions sold by independent online stores, which is what most Shopify merchants mean by the term.
What to do instead. Quote a range with each firm’s definition, or use measured figures: store and retailer counts (entries 10 to 14) and company filings (entries 15, 21, 51 to 53).
- US retail e-commerce was 17.1% of total retail sales in the second quarter of 2026, at $340.2 billion seasonally adjusted, up 12.2% year on year. Source: US Census Bureau, Quarterly Retail E-Commerce Sales, released 18 August 2026. Measures: all online retail sales; the Census does not measure subscriptions separately. Primary: government. The third-quarter figure is due on 19 November 2026.
How many retailers and Shopify stores sell subscriptions?
- In 2026, 3.2% of the online retailers in Digital Commerce 360’s North American Top 1000 used a subscription model in some form. Source: Digital Commerce 360, 14 May 2026. Measures: retailers in its ranking of the largest online sellers; the article does not define “subscription model” and its examples range from replenishment to digital asset subscriptions. Research firm dataset.
- Among Top 1000 retailers, subscription adoption was highest in food and beverage, at 25.0%, followed by health and beauty at 12.2%. Source: Digital Commerce 360, 14 May 2026. Measures: share of retailers in each category of its Top 1000. Research firm dataset.
- Top 1000 retailers with a subscription model had an average conversion rate of 4.5%, against 3.1% for those without. Source: Digital Commerce 360, 14 May 2026. Measures: an average across retailers; it is an association, and large replenishment sellers such as Chewy are in the subscription group, so it does not show that adding subscriptions lifts conversion. Research firm dataset.
- StoreLeads counted 192,442 installs of 20 subscription apps across 3,245,947 live Shopify stores, so at most about 5.9% of Shopify stores have a subscription app installed. Source: StoreLeads, Shopify and its app reports, updated 6 November 2026. Measures: installs, not active subscription programs; a store with two apps counts twice, so 5.9% (our arithmetic) is a ceiling. Research firm dataset, one provider.
- On StoreLeads’ 6 November 2026 data, installs of Shopify’s free Subscriptions app rose 61.2% in a year to 18,717, while Recharge, the largest app, fell 14.4% to 50,260. Source: StoreLeads, Shopify Subscriptions and StoreLeads, Recharge, updated 6 November 2026. Measures: installed stores; Seal (+28.1% to 33,783) and Appstle (−6.1% to 34,031) are the next largest. Research firm dataset, one provider. For what those apps cost, see the best Shopify subscription apps compared.
- Chewy’s Autoship customer sales were $2,817.2 million in the quarter to 2 August 2026, up 9.3% and 84.6% of net sales, against 83.0% a year earlier. Source: Chewy, Form 8-K exhibit, 9 September 2026. Measures: sales to Autoship customers as Chewy reports them; the release does not define the line. Primary: company filing or results.
- Slightly more than a quarter of US Amazon customers had an active Subscribe & Save order in the latest twelve months, most often for recurring basics such as cleaning supplies and vitamins. Source: Consumer Intelligence Research Partners (CIRP), 11 August 2026. Measures: a consumer survey of US Amazon customers; the sample is behind the paywall. Research firm dataset.
- Recharge describes its 2026 trend data as covering 20,000 brands, against the 50,260 Shopify stores StoreLeads counts with Recharge installed. Source: Recharge Subscription Trend Report 2026 and StoreLeads, Recharge. Measures: the gap shows that an install count is not a count of active subscription programs. Vendor platform data and research firm dataset.
What are typical subscription churn and retention rates?
These benchmarks come from billing platforms and from a few listed companies. The platforms do not publish their merchant mix, so treat a benchmark as a range to compare against, not a target. How to measure your own churn is in Shopify subscription analytics, and what moves it is in how to reduce subscription churn.
- Recurly’s July 2026 data puts ecommerce subscription churn at 4.25%, of which 2.87% is voluntary and 1.38% involuntary, so failed payments cause about a third of it. Source: Recurly churn rate benchmarks, July 2026 data. Measures: median rates across Recurly’s network; the page labels them annual, but the same page says a 2% monthly rate compounds to roughly 22% a year, so these are almost certainly monthly. Quote the split, not the level. No sample size given. Vendor platform data.
- Stripe data analysed by Churnkey puts annual churn for merchandise subscriptions at 39%, of which 9 points are involuntary, or 23% of the total. Source: Churnkey, involuntary churn benchmarks, published 14 November 2025, updated 12 December 2025. Measures: Stripe’s 2024 data, “$1.4 trillion across 200 million subscriptions”, plus Churnkey’s own customers. Vendor platform data.
- Across Recharge brands, about 61% of voluntary cancellations happened at the first two renewals, and roughly 72% within the first four. Source: Recharge, Subscription churn is front-loaded, July 2026. Measures: renewal cycles from July 2025 to March 2026 across “20,000+ subscription brands”; no subscriber count. Vendor platform data. Why the third delivery matters is in the month-3 churn cliff.
- BARK, a curated dog-box company, reported monthly subscriber retention of 94% in the quarter to 30 September 2026, up from 92% a year earlier. Source: BARK, Form 8-K exhibit, 5 November 2026. Measures: active subscriptions in a month divided by the prior month’s, excluding new subscriptions, averaged over the quarter. One company. Primary: company filing or results.
- Among Recharge subscribers who reached each renewal, 24.1% cancelled at the first renewal and 27.1% at the second, the peak. Source: Recharge, Subscription churn is front-loaded, July 2026. Measures: the cancellation rate at each cycle, July 2025 to March 2026. Vendor platform data.
- Recurly reports that pause usage rose 337% year on year at merchants offering “pause before cancel”. Source: Recurly, 2026 State of Subscriptions, January 2026. Measures: “76 million unique subscribers and 2,200 global merchants”, mostly digital and software businesses. Vendor platform data.
- Recurly reports that 3 out of 4 subscribers who pause eventually return. Source: Recurly, 2026 State of Subscriptions, January 2026. Measures: cross-industry; no denominator or time window is published. Vendor platform data.
- Recharge reported an average save rate of 9.6% for its pause feature, across more than 1,700 merchants using it four months after launch. Source: Recharge, April 2023. Measures: cancellations turned into pauses; three years old. Vendor platform data. More on pausing in why the skip button is a retention tool.
- Recurly reports that former subscribers drive nearly 1 in 4 new sign-ups. Source: Recurly, 2026 State of Subscriptions, January 2026. Measures: cross-industry, mostly digital. Vendor platform data.
How much churn comes from failed payments, and how much can be recovered?
Involuntary churn is the share a merchant can most directly fix. The step-by-step version for Shopify is in how to recover failed subscription payments.
- On Recurly’s July 2026 data, involuntary churn is about 30% of churn for subscriptions priced $10 to $25 a month and about 29% for $25 to $50, falling to about 16% for $100 to $250. Source: Recurly churn rate benchmarks, July 2026 data. Measures: our arithmetic on Recurly’s published band medians (1.30 of 4.29; 1.11 of 3.84; 0.46 of 2.87). Vendor platform data.
- Stripe data analysed by Churnkey puts involuntary churn at 35% of churn for orders under $10, 23% for $10 to $30, 26% for $30 to $100 and 19% for $100 to $1,000. Source: Churnkey, published 14 November 2025. Measures: share of total churn by average order value, 2024 data. Vendor platform data.
- Stripe’s Smart Retries alone recovered 51% of failed subscription payments, taking 5.5 days on average. Source: Churnkey, published 14 November 2025. Measures: 2024 Stripe data; with Churnkey’s own retries added, recovery was 55% in 4.8 days. A mostly digital dataset. Vendor platform data.
- Recurly reports that 90% of recovered transactions are recovered within the first 10 days after a failed payment. Source: Recurly, failed payment recovery, 30 April 2026. Measures: Recurly network data; the same post says optimised retry strategies improved recovery by 10 to 20 percentage points over single-merchant retry logic. Vendor platform data.
- Shopify fails, and revokes the payment method on, any attempt to re-bill a failed payment with the same customer payment method more than 30 times in 35 days. Source: Shopify, build a subscription contract, read 17 November 2026. Measures: a platform rule that caps any retry schedule. Primary: platform documentation.
- In payment-card data covering ten subscriptions, months in which a subscriber’s card was replaced had much higher cancellation rates. Source: Einav, Klopack and Mahoney, “Selling Subscriptions”, American Economic Review 115(5), May 2025. Measures: data from a large payment card network; the authors estimate that inattention raises seller revenue by 14% to more than 200% compared with fully attentive customers. Our reading for merchants: a card update is a moment when a subscriber reconsiders as well as a moment when a payment can fail. Primary: peer-reviewed.
- Merchants surveyed by Chargebacks911 attributed 43.8% of their chargebacks to friendly fraud. Source: Digital Transactions on the Chargebacks911 2026 Field Report, 28 August 2026. Measures: a survey of more than 250 merchants across industries. Vendor survey.
How do discounts, price and plan length affect retention?
The repricing mechanics on Shopify are in how to raise subscription prices without losing subscribers, and whether a discount code repeats on every renewal is in first order or every renewal.
- Across Recharge brands, first-order discounts rose 18%, same-day cancellations fell 35% and subscription checkouts rose 16% against one-time purchases. Source: Recharge Subscription Trend Report 2026, May 2026. Measures: the public landing page of a gated report on 20,000 brands; no period is stated. Vendor platform data.
- Recharge reports that 65.0% of subscribers with no first-order discount reached their first renewal, against 53.4% of those whose first order was 90% off or more. Source: Recharge, The first-order discount sweet spot, July 2026. Measures: about 29.8 million subscriptions first paid between July and December 2025; Recharge calls it an association. Vendor platform data.
- Comparing subscribers inside the same store, across 350 Recharge stores, 64.1% of those discounted under 20% reached a first renewal against 55.1% of those discounted 60% or more, and 248 of the 350 stores showed the gap. Source: Recharge, The first-order discount sweet spot, July 2026. Measures: a within-store comparison, which removes differences between brands. Vendor platform data.
- At the 2,037 Recharge brands that sell an annual plan, 48.0% of annual subscribers who joined on Black Friday were still active at month 13, against 15.7% of monthly subscribers, about three times as many. Source: Recharge, 2026 Black Friday marketing strategy, September 2026. Measures: a like-for-like comparison at the same brands; Recharge notes that annual buyers are already higher-intent. Vendor platform data.
- Recurly reports that annual plans generate 50% to 60% higher revenue per user. Source: Recurly, 2026 State of Subscriptions, January 2026. Measures: cross-industry, mostly digital; the comparison base is not stated. Vendor platform data.
- On Recurly’s July 2026 data, median churn falls as price rises, from 4.29% for subscriptions priced $10 to $25 a month to 2.87% for $100 to $250. Source: Recurly churn rate benchmarks, July 2026 data. Measures: medians by average revenue per customer; it does not show that raising a price lowers churn. Vendor platform data.
- Recharge reports that subscribers placed nearly 3 times as many orders as one-time shoppers. Source: Recharge Subscription Trend Report 2026, May 2026. Measures: the public summary of a gated report; no period is stated. Vendor platform data.
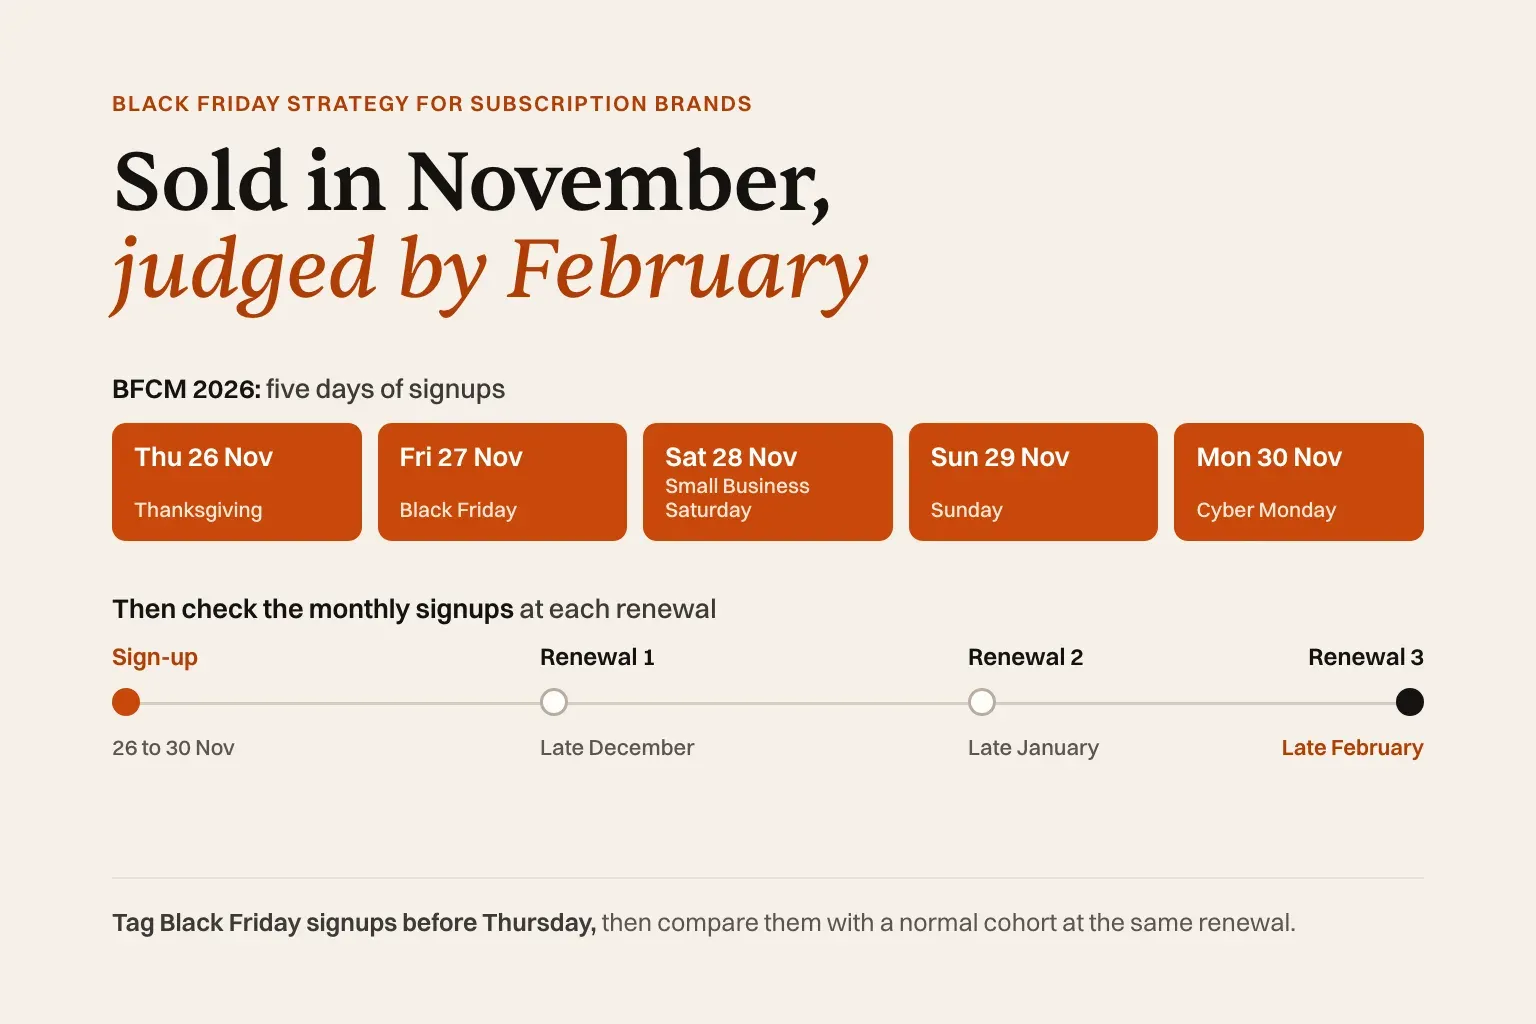
When do subscribers sign up, and what does Black Friday do?
How to run the week is in Black Friday strategy for subscription brands, and what to do at each renewal afterwards is in how to keep Black Friday subscribers.
- On Recharge’s platform, Black Friday to Cyber Monday brought 2.38% of the year’s new subscriptions in 2025: 1,767,388 of 74,269,629. Source: Recharge, 2026 Black Friday marketing strategy, September 2026. Measures: the five days are 1.4% of the calendar, which Recharge says makes the week about 1.7 times as valuable as a random week; it adds that late January usually beats it on raw volume. Vendor platform data.
- Averaged over 2021 to 2025, Black Friday brought about 2.0 times an average October day’s subscription sign-ups on Recharge, and Cyber Monday 1.95 times. Source: Recharge, September 2026. Measures: daily sign-ups across Recharge brands; Thanksgiving ran at about 1.1 times. Vendor platform data.
- Of Black Friday to Cyber Monday sign-ups on Recharge, 71.4% were monthly, 21.4% quarterly and 7.2% annual, against 83.0%, 13.9% and 3.1% at New Year. Source: Recharge, September 2026. Measures: plan length chosen at sign-up. Vendor platform data.
- On Recharge’s monthly plans from 2022 to 2024, 46.8% of Black Friday subscribers reached a second order, against 43.4% of subscribers who joined the rest of the year. Source: Recharge, September 2026. Measures: Black Friday cohort defined as Thanksgiving to Cyber Monday. Vendor platform data.
- Recharge brands that discounted Black Friday 10 or more points deeper than their own usual rate came out a median 2.5 points behind their own rest-of-year retention at month 13. Source: Recharge, September 2026. Measures: 3,232 brands in November 2022, 2023 and 2024, 5,715 measurements in all, with a brand counted once for each year it qualified; 2.5 points is the table’s figure, and Recharge’s text rounds it to about two. Brands that priced Black Friday like any other week came out level. Recharge presents it as an association. Vendor platform data.
- Shopify merchants’ Black Friday to Cyber Monday sales in 2025 were $14.6 billion, up 27%, with an average cart of $114.70. Source: Shopify, 2 December 2025. Measures: global sales online and in person, approximate and unaudited according to Shopify’s footnote; the release contains no subscription data. Primary: company filing or results.
Subscription box statistics: who buys boxes and replenishment, and how box businesses are doing
The box market estimates are entries 6 to 8 above. For which app suits which kind of box, see Shopify subscription box apps, compared by the kind of box you run.
- In a January 2026 survey, 4% of US respondents paid for a physical-goods subscription box, against 46% for a retail subscription and 55% for video streaming. Source: Bango, Subscription Signals 2026, published April 2026. Measures: 4,000 US and UK consumers surveyed by 3Gem for Bango. We read the figures from the PDF’s text layer, where the category labels and values appear in the same order. Vendor survey.
- BARK’s direct-to-consumer revenue fell to $61.8 million from $82.1 million a year earlier, in the same quarter its monthly subscriber retention rose to 94%. Source: BARK, Form 8-K exhibit, 5 November 2026. Measures: quarter to 30 September 2026; management attributed the fall to a planned pullback in marketing spend. Primary: company filing or results.
- HelloFresh’s orders fell 17.9% to 19.6 million in the third quarter of 2026 while average order value rose 7.5% to €70.5. Source: HelloFresh Q3 2026 release, 5 November 2026. Measures: a meal-kit subscription company; marketing expense fell 24.1% and the company cited lower new-customer acquisition. Primary: company filing or results.
- Grove Collaborative’s direct-to-consumer active customers fell 30.6% to 458,000 in the third quarter of 2026, while net revenue per order rose 6.1% to $70.85. Source: Grove Collaborative, Form 8-K exhibit, 10 November 2026. Measures: a household-refill business; it cited a smaller customer base and lower advertising. Primary: company filing or results.
- Food and drink stores are the largest category among installs of Shopify’s own Subscriptions app (26.8%), Seal (25.3%) and Appstle (22.9%), while apparel leads among Recharge installs (20.3%). Source: StoreLeads app reports, updated 6 November 2026. Measures: store categories of installed stores. Research firm dataset, one provider.
Entries 21 and 48 to 50 point the same way: in autumn 2026, listed subscription businesses reported fewer customers or orders and more revenue per customer or order, because they cut acquisition spending. That is our reading of four filings, not a measured trend.
Why do consumers cancel subscriptions, and what keeps them?
- 52% of consumers cancelled at least one subscription in the past year because they were not using it. Source: Recurly, 2026 State of Subscriptions, January 2026. Measures: a consumer finding inside Recurly’s report; no sample size is published and most subscriptions in it are digital. Vendor survey.
- Nearly 3 in 5 consumers said they had paused a subscription instead of cancelling it. Source: a Chargebee survey reported by CX Dive, 15 January 2026. Measures: a consumer survey fielded in September; the article gives no sample size. Vendor survey.
- More than 4 in 5 consumers said they are more likely to subscribe if they know cancellation is easy. Source: Chargebee survey reported by CX Dive, 15 January 2026. Measures: stated intent, not behaviour. Vendor survey. For UK merchants, easy online cancellation becomes a legal duty for new contracts from 1 January 2027, pending parliamentary approval; see the UK’s new subscription rules.
- Americans hold 5.2 paid subscriptions on average and pay $69 a month for them. Source: Bango, Subscription Signals 2026, published April 2026. Measures: US respondents to a 4,000-person US and UK survey fielded in January 2026, covering streaming, retail and other categories; Bango sells subscription bundling services. Vendor survey.
- A second 2026 survey put the average at 3.4 paid subscriptions and $35.03 a month, with 59.9% holding one they had not used in the past 30 days. Source: Self Financial, survey of 1,272 US adults, March 2026. Measures: its unused-subscription figure swung from 85.7% in 2024 to 54.9% in 2025, which suggests an unstable panel. Quote one survey with its definition; never average this with entry 55. Vendor survey.
- The FTC’s September 2025 settlement with Amazon over Prime enrolment and cancellation totalled $2.5 billion: a $1 billion civil penalty and $1.5 billion in refunds, for an estimated 35 million consumers. Source: Federal Trade Commission, 25 September 2025. Measures: the settlement terms; eligible customers can receive up to $200 in total under the redress order. Primary: government.
AI assistants and agentic commerce: what is measured so far?
How each AI channel handles a subscription today is in can an AI agent buy your Shopify subscription?.
- Shopify reported that AI traffic was up 2.6 times year on year in the third quarter of 2026, with orders from it growing 3.3 times. Source: Shopify Q3 2026 earnings call, transcript, 3 November 2026 (Harley Finkelstein: “AI traffic is up 2.6x year-over-year. Orders are growing even faster at 3.3x”). Measures: growth multiples, not shares; no subscription breakdown. Primary: company filing or results.
- In the direct checkout Shopify merchants can offer in Google’s AI Mode and Gemini, products sold only as subscriptions are excluded, and a product with both options sells as a one-time purchase only. Source: Shopify Help Center, Google, read 17 November 2026. Measures: a platform rule; Shopify documents the same subscription limit for Microsoft Copilot and Meta. Primary: platform documentation.
- Recurly reports that 43% of users are comfortable with AI managing their subscriptions. Source: Recurly, 2026 State of Subscriptions, January 2026. Measures: no sample size published. Vendor survey.
- 20% of Americans would let AI automatically subscribe, manage and unsubscribe them from their services. Source: Bango, Subscription Signals 2026, published April 2026. Measures: stated willingness in a streaming-led survey fielded January 2026. Vendor survey.
Which widely repeated subscription statistics did we leave out?
These numbers appear on many statistics pages. Each was traced as far as it would go and left out for the reason given.
| Widely repeated figure | What it traces to | Why it is not on this page | Use instead |
|---|---|---|---|
| “Subscription e-commerce will reach $904.2 billion by 2026” | A 2022 press release for The Business Research Company’s 2022 report | A four-year-old forecast. The same firm’s 2026 edition says $859.52 billion for 2026, on a definition that includes software and streaming | The range in entries 1 to 5 |
| “68% of churn is involuntary”, attributed to Recurly | Statistics roundups | Recurly’s own July 2026 page gives 1.38% involuntary out of 4.25% for ecommerce, about a third | Entries 18 and 19 |
| “Average subscription ecommerce churn is 3.4% a month”, attributed to Recurly | Statistics roundups | Not on Recurly’s page, which gives 4.25% for ecommerce and 3.60% across industries | Entry 18, with its caveat |
| “Subscription boxes churn 10–15% a month” | Vendor guides and roundups citing one another | No dataset behind it. BARK, a curated box, discloses 94% monthly retention | Entry 21 |
| “44% of cancellations happen in the first 90 days” | Roundups and agency blogs | No primary source found | Entries 20 and 22 |
| “15% of online shoppers subscribe”; the market “grew more than 100% a year”; “$57 million in 2011 to $2.6 billion in 2016” | McKinsey, February 2018, from a survey fielded in late 2017 | Real, but eight years old and describing 2011 to 2017. If you use them, label them 2018 | Entries 10, 16 and 47 |
| “The subscription box industry grew 12.6% in 2026” | SubSummit’s April 2026 report, which names no source | 12.6% is Recurly’s cross-industry subscription growth on its own platform, mostly software and media | Nothing measured; no box-industry growth figure exists |
| “Americans spend $219 a month on subscriptions” | A 2022 C+R Research survey, widely recycled | Four years old and dominated by streaming and software | Entry 55, with its definition |
| “Recharge powers 71% of Shopify subscriptions” | Recharge’s own marketing | A vendor’s claim. StoreLeads gives Recharge about 26% of tracked subscription-app installs (our arithmetic) | Entry 14, or “Recharge says it powers 71%” |
| “Annual subscribers retain nearly 6x better” | Recharge’s headline comparison of 59.3% against 9.4% at month 13, taken across all brands | Not like for like: most brands sell no annual plan. At the 2,037 brands that do, the ratio is about 3 times | Entry 37 |
| Recharge 2026 report: vertical churn of 8.8%, 8.4%, 8.1%, 7.7% and 3.9% a month; “59% more orders”; “54% of revenue”; “$319” | Secondary write-ups of the gated report | Not checked against the report. “59% more orders” conflicts with Recharge’s own public “nearly 3x” | Entries 34 and 40 |
| “Shopify merchants made $14.6 billion online over BFCM 2025” | Shopify’s 2 December 2025 release | The figure includes in-person sales | Entry 46, worded as Shopify words it |
| Shopify’s “Subscription Solutions” revenue (up 20% to $836 million in Q3 2026) read as subscription-commerce growth | Shopify Q3 2026 release, 3 November 2026 | It is what merchants pay Shopify for its plans; Shopify defines the matching MRR as “the aggregate value of all subscription plans” | Nothing: Shopify publishes no subscription-commerce figure |
| “2.3x higher cancellation via agents”, “34% of subscriptions agent-managed by 2027”, “61% would let agents manage”, “40% churn reduction” | One vendor blog that cites no source | Untraceable | Entries 58 to 61 |
| “Friendly fraud is 80% of disputes” | Many blogs | No opened source. Chargebacks911’s “86%” is its own clients’ data, a different basis | Entry 33 |
| “47% cancelled a subscription, up from 31%”; “41% feel subscription fatigue”; “87% of Gen Z”; “42% pay for subscriptions they no longer use” | Blogs attributing them to Zuora, CivicScience and others | No primary study could be opened | Entries 52 and 56 |
How this page is kept current
Most of these sources publish on a cycle, so the page is refreshed when a new edition lands and every changed entry gets its new date. These are the next ones to watch, as of 17 November 2026.
| Source | Edition used here | Refresh |
|---|---|---|
| US Census Bureau, Quarterly Retail E-Commerce Sales | Q2 2026, released 18 August 2026 | Q3 2026 is due on 19 November 2026 |
| Recurly, State of Subscriptions | 2026 edition, January 2026 | Annual |
| Recurly, churn rate benchmarks | July 2026 data | Updated periodically |
| Recharge, Subscription Trend Report | 2026 edition, May 2026 | Annual |
| Digital Commerce 360, Top 1000 | 2026 edition | Annual |
| StoreLeads install counts | Updated 6 November 2026 | Rolling |
| BARK, Chewy, Grove, HelloFresh, Shopify | Quarters ending August to September 2026 | Quarterly results |
| Shopify BFCM results | 2025 results, published 2 December 2025 | After Cyber Monday 2026, if Shopify publishes again |
| Market-size estimates (entries 1 to 8) | Pages dated May to November 2026 | Re-read yearly; they change without notice |
If you find a newer edition or an error, email hello@curobi.com and we will check it against the source.
Where Curobi fits
Curobi is a Shopify subscription app. It does not publish platform statistics of its own yet, so nothing above comes from Curobi data. Several of the measures on this page map to things its plans include: skip, pause and cancel in the customer portal, and a cancellation reason survey, on every plan, Free included; failed-payment retries on days 2, 4 and 7 with an update-card email from Starter ($9.99 per 30 days); and a payment recovery dashboard, Churn Insights and cohort analytics from Growth ($19.99). Curated boxes and build-a-box are on Pro ($69.99). Every plan has 0% Curobi transaction fees, and Shopify’s own payment processing fees still apply. Plans and limits are on the pricing page.
Frequently asked questions
How big is the subscription e-commerce market?
There is no agreed figure. Estimates published in 2026 for the global subscription e-commerce market in 2026 run from $22.51 billion (Precedence Research) to $3.09 trillion (Fortune Business Insights), with The Business Research Company at $859.52 billion and IMARC at $586.0 billion. The spread comes from definitions: the largest figures count video streaming, software and other digital subscriptions, and none of the four publishes a method someone else could repeat. Quote a range with each firm’s definition, or use measured figures such as store counts and company filings.
What is a normal churn rate for an ecommerce subscription?
The two largest public datasets measure different periods, so compare like with like. Stripe data analysed by Churnkey puts annual churn for merchandise subscriptions at 39% (2024 data). Recurly’s July 2026 data gives 4.25% for ecommerce, labelled annual but almost certainly a monthly rate. One company can sit far from both: BARK reported 94% monthly subscriber retention for the quarter to 30 September 2026. Your own cohorts are a better yardstick than any borrowed benchmark.
How much subscription churn is caused by failed payments?
About a quarter to a third. Recurly’s July 2026 ecommerce figures put involuntary churn, the churn caused by failed payments, at 1.38% of a 4.25% total, about a third, and Stripe data analysed by Churnkey puts it at 23% of churn for merchandise subscriptions (2024 data). The widely repeated claim that 68% of churn is involuntary does not match Recurly’s own published figures.
How many retailers offer subscriptions?
Few of the largest. Digital Commerce 360 reported in May 2026 that 3.2% of the online retailers in its North American Top 1000 used a subscription model in some form, rising to 25.0% in food and beverage. On Shopify, StoreLeads counted 192,442 installs of 20 subscription apps across 3,245,947 live stores on 6 November 2026, so at most about 5.9% of stores have one installed.
How many people pay for a subscription box?
In Bango’s survey of 4,000 US and UK consumers, fielded in January 2026, 4% of US respondents paid for a physical-goods subscription box, against 46% for a retail subscription. Replenishment reaches further: CIRP reported in August 2026 that slightly more than a quarter of US Amazon customers had an active Subscribe & Save order. The often-quoted figure that 15% of online shoppers subscribe comes from McKinsey’s 2018 study.
Sources
- Government and filings: US Census Bureau, Quarterly Retail E-Commerce Sales (18 August 2026); SEC filings from BARK (5 November 2026), Chewy (9 September 2026), Grove Collaborative (10 November 2026) and Shopify (3 November 2026); HelloFresh Q3 2026 release (5 November 2026); Shopify Q3 2026 earnings call transcript; Shopify BFCM 2025 results; FTC, Amazon settlement and redress order.
- Peer-reviewed: Liran Einav, Benjamin Klopack and Neale Mahoney, “Selling Subscriptions”, American Economic Review 115(5), May 2025, pp. 1650–71 (NBER Working Paper 31547, August 2023).
- Platform documentation: Shopify, build a subscription contract and Help Center, Google, read 17 November 2026.
- Research firms: Digital Commerce 360 (14 May 2026); StoreLeads (updated 6 November 2026); CIRP (11 August 2026); Self Financial (March 2026 survey).
- Market-size estimates: Fortune Business Insights, subscription e-commerce and subscription box; The Business Research Company, subscription e-commerce and subscription box; IMARC Group, subscription e-commerce and subscription box; Mordor Intelligence; Precedence Research. Read 13 to 17 November 2026.
- Vendor platform data and surveys: Recurly, 2026 State of Subscriptions, churn rate benchmarks and failed payment recovery; Churnkey on Stripe data; Recharge, Subscription Trend Report 2026, 2026 Black Friday marketing strategy, The first-order discount sweet spot, Subscription churn is front-loaded and pause subscriptions (April 2023); Bango, Subscription Signals 2026; Chargebee survey via CX Dive; Chargebacks911 via Digital Transactions.
- Older study referenced in the left-out table: McKinsey, Thinking inside the subscription box (February 2018).
- Curobi’s plans and features: its pricing page, from Curobi’s product documentation as of 13 November 2026.
Last checked 17 November 2026. Figures keep the date of their source; none is a 2027 measurement.